
Saturday, 3 April 2010
Discovery and Construction of Authors’ Profile from Linked Data
This looks useful and relevant. No idea where I found it, will dig it out later.

Thursday, 1 April 2010
The Next Sprint
Before I tidy up the code so far (it's a mess trust me) ... the next Sprint will be all about integration. The reason for this is that it's all very well having a noodley toy with which people can browse and explore and vanity surf but unless it is integrated into a tool that someone uses very regularly then it will never have the chance to prove itself.
The tool we will be using as a collaborative platform will be Cyn.in because ...
The tool we will be using as a collaborative platform will be Cyn.in because ...
- it has a plethora of tools, wikis, blogs, discussions, events etc
- it has a lovely UI
- it is written in Plone and python is my tool of choice
My work following Easter will look something like this...
- Find out more about Plone (I've bought a book :-)
- Create a script that inserts objects into the ZODB (in this case events crawled from the University site)
- Create a new "content type"... I would quite like to create a "Location" object.
- Create (or install) an RSS reader so we can add tweets, feed etc.
- See if there's a LATEX option for the kinky scientists
- Make a portlet to display this stuff
- Lighten the overall look n feel.
- Make a "content parser" so that key terms in a taxonomy can be automatically replaced (e.g. SIPIG (a commitee), VC011 (my room number) and dps4 (my boss) with links to the relevant items.
- Create (or install) a JSON reader so that we can potentially dynamically find "related people" and display them on peoples' profiles
That looks like two weeks work to me (or more).... I may be gone sometime...
Wednesday, 31 March 2010
Put It All Together... Version 0.1
I couldn't resist connecting the web site tag cloud terms to people associated with those terms to a person's hypertree.
Here it is... PPPeople PPPowered version Alpha 0.1 (yes there are bugs and interface issues but it's still lots of fun).
Here it is... PPPeople PPPowered version Alpha 0.1 (yes there are bugs and interface issues but it's still lots of fun).
Tuesday, 30 March 2010
My very first Hyperforest
So today I decided to look at little deeper at WHAT I want to plot on a Hypertree anyway. It's quite a difficult question. The purpose of all this, ultimately, it to be a browsing experience (not a reporting one) so I don't care if the diagram is an accurate reflection all that matters is that if it is accurate enough to flush out some interesting connections.
The diagram should look plausible but then have oddities in. So.... today I took a simplistic view that went...
The end results are a quite good...
Gustav Delius - a mathematician who is involved in lots of web projects looks like this...

Trevor Sheldon - the Deputy Vice Chancellor looks like this...

Sue Hodges - Educator definitely not into social media self-promotion looks like this...

It's looking promising. The pictures look great... now if I can just fathom what they mean I'll be laughing.
Tomorrow I need to research talking to the ZODB and how to make custom object types in Plone so that I can take this data and integrate it into a social networking site we're running.
The diagram should look plausible but then have oddities in. So.... today I took a simplistic view that went...
- What web documents is someone mentioned in
- What topics are associated with those documents
- What terms are those documents associated with (and which topics)
- Who else is on the documents that have those terms
The end results are a quite good...
Gustav Delius - a mathematician who is involved in lots of web projects looks like this...

Trevor Sheldon - the Deputy Vice Chancellor looks like this...

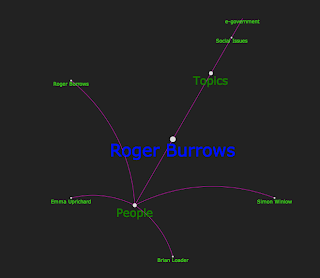
Roger Burrows - Sociologist who might be said to have concerns about technology and privacy (forgive me if I'm wrong Roger)... looks like this...

Sue Hodges - Educator definitely not into social media self-promotion looks like this...

It's looking promising. The pictures look great... now if I can just fathom what they mean I'll be laughing.
Tomorrow I need to research talking to the ZODB and how to make custom object types in Plone so that I can take this data and integrate it into a social networking site we're running.
Monday, 29 March 2010
My Very First Hypertree
Sometimes, in fact most of the times for me, I find it difficult to work with certain concepts until I can see them. I began today by making the templates that could just show the data I have gathered from Open Calais so that I could get a feel for what's there.
And just now I started adding a little Hypertree magic. Here's some of the data displayed quite simply.


I'm pleased that I'm able to display something. I now need to work on the user interface and add a nice search interface and popup areas for "people information" and maybe to be able to load more data as you click on a node.
I also now need to think about which connections between people are most important and perhaps how to structure the industry terms.
And just now I started adding a little Hypertree magic. Here's some of the data displayed quite simply.

The funny shape makes me realise that I've made a completely arbitrary three-way split of pages, people and terms and that I need to make it build its hierarchy dynamically. Ooh that one hurts.
It looks even stranger when someone happens to have been in lots of pages about meeting minutes. Here's Jo Casey as a Hypertree.

I'm pleased that I'm able to display something. I now need to work on the user interface and add a nice search interface and popup areas for "people information" and maybe to be able to load more data as you click on a node.
I also now need to think about which connections between people are most important and perhaps how to structure the industry terms.
This Week's Plan
My plans for this sprint are to create a navigable interface for the data Open Calais has returned that focusses on people and connections between people. To begin with this might just be "people pages" or an A to Z page but I also was to quickly start using a few lovely visualisations.
I then want to host this data on a site that people can play with (and into a subversion repository). I will initially use Django simply because I'm very familiar with it but the intention is that this will add data to a Cyn.in (or Plone site) so I have bought a book on Plone development so I can start thinking about saving data to the ZODB...
So that I can start simply and learn how the ZODB works, the plan is to...
Slight concern: This sort of means that I'll be splitting my direction... one will be looking at visualisation in Django/MySQL the other is looking at data manipulation and integration within Cyn.in (the environment that will ultimately host this data). I'm hoping that once I have got to the end of the visualisation experimentation and the Cyn.in integration work I will be able to pull the two neatly together somehow.
Visualisation Tools
Infovis looks simple enough and perfect for what I need. I particularly like the Hypertree thing (shown below). Here Jeni has taken some government open data about burglary and shown it on a hypertree... brilliant!

The yFiles library has aGraph viewer component but it seems too complete, and it's not as black (which is cool).

Protovis has some very nice display options, I may come back to this later.

I then want to host this data on a site that people can play with (and into a subversion repository). I will initially use Django simply because I'm very familiar with it but the intention is that this will add data to a Cyn.in (or Plone site) so I have bought a book on Plone development so I can start thinking about saving data to the ZODB...
So that I can start simply and learn how the ZODB works, the plan is to...
- Create a crawler for events that saves regular "Events" objects into the ZODB.
- Create a new content type for "Places". This may have a lat/long and in the long term should be displayed on a map.... maybe on an iPhone. This is a bit more involved
- Create an RSS or RDF grabber Product so that I can integrate people, places, concepts etc with other linkeddata sources... if only to grab an image that represents York the city.
Slight concern: This sort of means that I'll be splitting my direction... one will be looking at visualisation in Django/MySQL the other is looking at data manipulation and integration within Cyn.in (the environment that will ultimately host this data). I'm hoping that once I have got to the end of the visualisation experimentation and the Cyn.in integration work I will be able to pull the two neatly together somehow.
Visualisation Tools
Infovis looks simple enough and perfect for what I need. I particularly like the Hypertree thing (shown below). Here Jeni has taken some government open data about burglary and shown it on a hypertree... brilliant!

The yFiles library has aGraph viewer component but it seems too complete, and it's not as black (which is cool).

Protovis has some very nice display options, I may come back to this later.

Both Raphael and Processing look extremely powerful (go look at the examples) but I will come back to them later once I've done the simple(r) stuff.
One of the lessons learned from the project already is that once you get lots of people working in an open environment that the "Activity Stream" soon resembles a fire-hose of "too much" information. This suggests that the Home Page of any collaborative environment needs to think about displaying aggregate data or visualisations rather than actual data as a way to make the Home Page useful. So it's going to be interesting to try and find novels ways of displaying what for the most part will be conversations.
Saturday, 27 March 2010
Sprint 1, it works
So having crawled the sites, mangled the data... some very simple code...
from djangocalais.models import *
def related_people(name):
es = Entity.objects.filter(name__icontains=name)[0]
cds = CalaisDocument.objects.filter(entities=es)
for cd in cds:
for e in cd.entities.all():
if e.type.name == "Person":
print e.name , ">", cd.__unicode__()
m.related_people("Alastair Fitter")

from djangocalais.models import *
def related_people(name):
es = Entity.objects.filter(name__icontains=name)[0]
cds = CalaisDocument.objects.filter(entities=es)
for cd in cds:
for e in cd.entities.all():
if e.type.name == "Person":
print e.name , ">", cd.__unicode__()
m.related_people("Alastair Fitter")
... produces this....

This is what I like.... Artificial Intelligence for Dummies. I can't wait to slap an interface on this... Now to brush up on some jQuery.
Subscribe to:
Posts (Atom)

